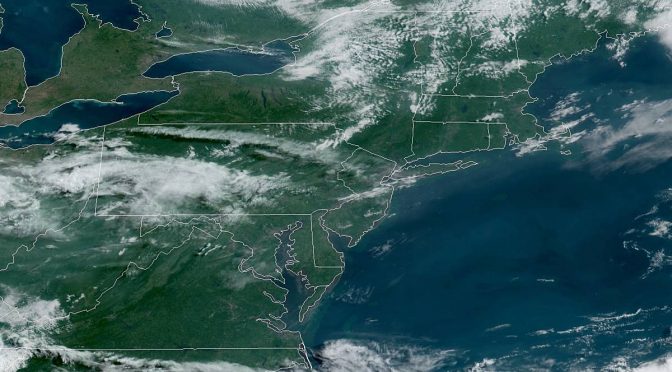
8 hour loop – 03:54PM EDT – 07.10.2019 #wx #satellite #GOESEast #philly #nyc #dc #boston pic.twitter.com/GVuEUHVOIS
— SatBot NorthEast (@Satellite_NE) July 10, 2019
ABOUT
I’m a big fan of NOAA in general but I’ve fallen in love with the real time imagery available from their GOES-16 satellite. Weather nerds are all over this stuff but I don’t think the general public has any idea this space imagery exists.
There are a few accessible points for the imagery, notably NOAA’s GOES site or the RAMMB SLIDER, but I wanted something that would make the imagery a little more immediate. I decided a Twitter bot would be the perfect tool to create animated satellite loops and then push them out to be seen by the world.
Originally built for an audience of 1 (myself), I was free to experiment and tweak the outputs to my liking. I focused on the north east US so I could have an hourly view of clouds in my area.
The bot has exceeded my expectations and it’s become a great tool that I check multiple times a day. It’s a great for tracking weather patterns and storms but I really just love watching clouds. I hope that this bot provides the same wonder and curiosity that it provides me.
Thanks to NOAA and everyone involved with GOES!
FAQ
Q: Can you cover different regions?
A: Probably, I’m considering expanding to cover new areas. Message me on Twitter.
Q: Why do you use the geocolor output?
A: I think it’s visually the most appealing and I’m targeting a broad audience here, not just weather nerds. I don’t like the geocolor night time output though. If you really want a different band, message me on Twitter, I’m curious to hear what you want.
Q: Why do your animated loops have low resolution?
A: I think the resolution is a good compromise between usability and Twitter’s video compression. It took some tweaking to get a good output, a really high quality output will get heavily compressed by Twitter and result in a worse animation.
Q: How did you choose the frequency and length of outputs?
A: I wanted something that would provide an hourly picture of the weather and I also wanted something that would provide nice long loops so you could see how the weather changed over the course of a day. The outputs try to address both goals but are still being tweaked.

